
How to Read a Crypto Trading Chart
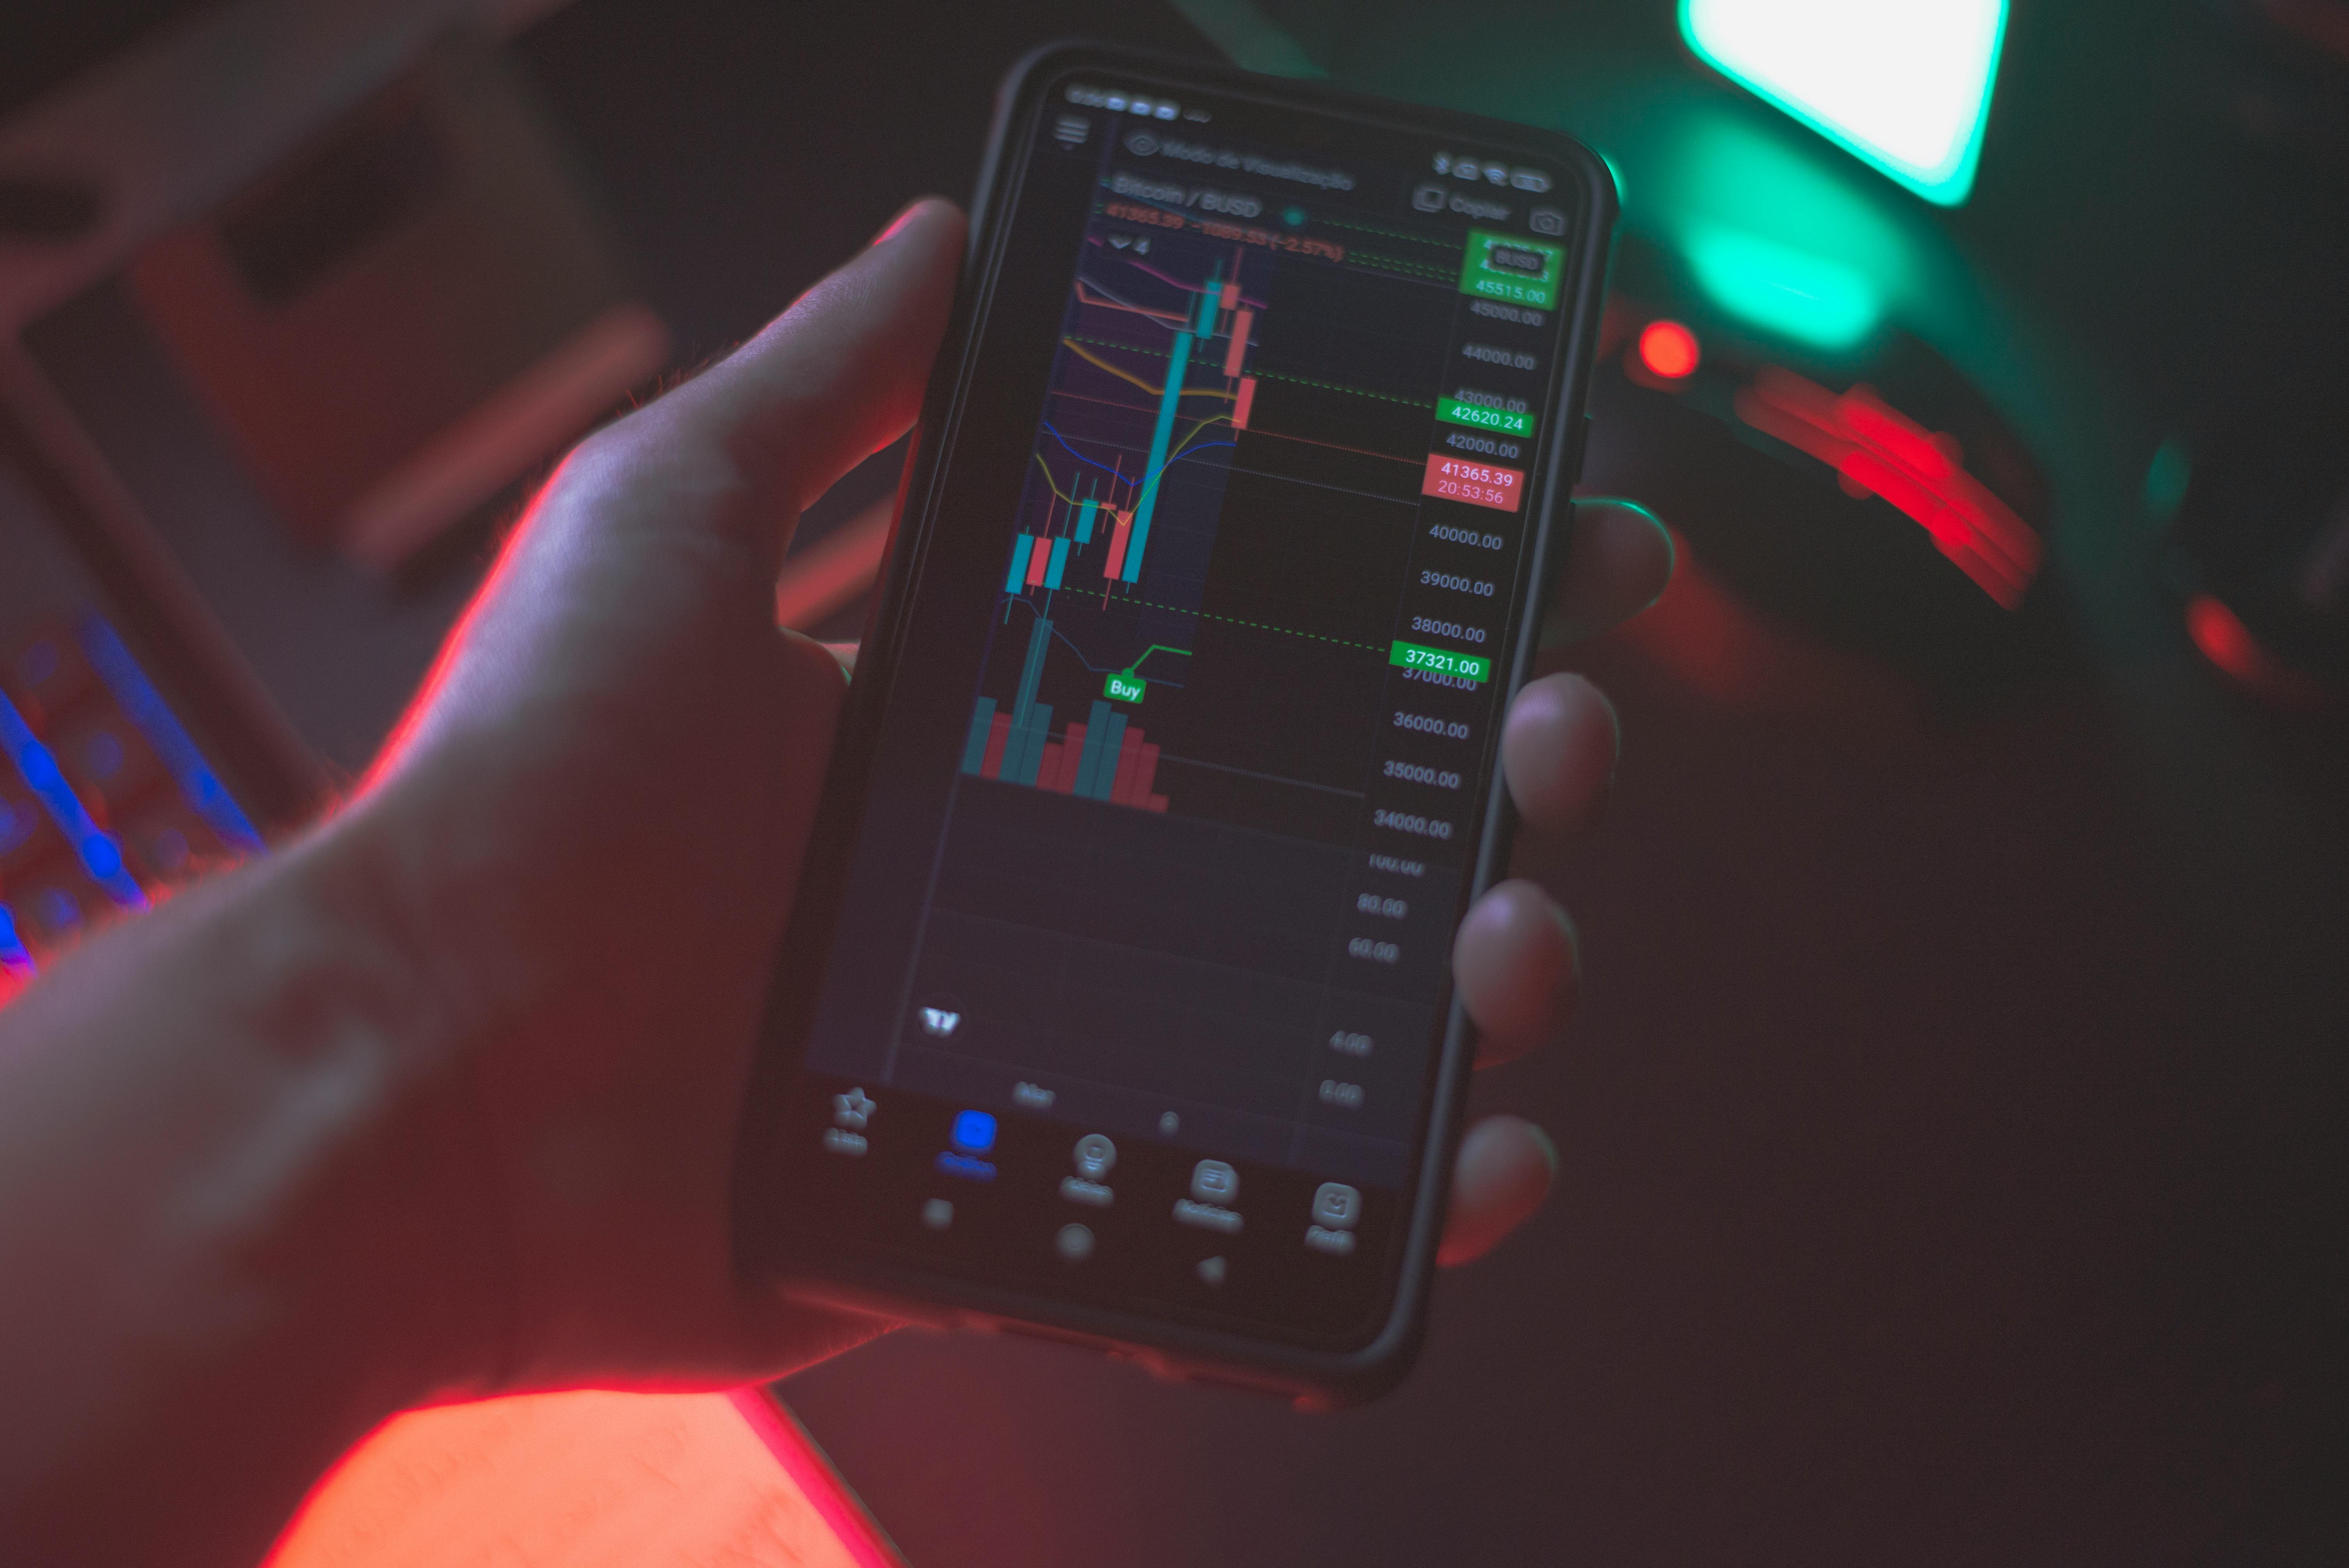
If you've ever opened a crypto trading platform like Binance, Coinbase Pro, or TradingView, you’ve probably been overwhelmed by all the charts, numbers, and colorful candles moving up and down. It may look confusing at first, but once you understand the basics, reading a crypto trading chart can become one of your most powerful tools in making smarter trading decisions.
In this beginner-friendly guide, I’ll break down how to read a crypto chart step by step — covering candlestick patterns, trading volume, popular technical indicators, and how to identify market trends. Whether you're investing in Bitcoin, Ethereum, or altcoins, mastering these fundamentals is crucial.
📈 What Is a Crypto Trading Chart?
A crypto trading chart is a visual representation of price movements over time. Traders use it to analyze past price behavior and predict potential future movements. The most common type of chart used in crypto trading is the candlestick chart, but there are others like line charts and bar charts.
Now let’s break it down further.
🕯️ Understanding Candlesticks
Each candlestick on a crypto chart shows how the price of an asset has moved over a specific time period — for example, 1 minute, 1 hour, or 1 day. Each candle has four data points:
-
Open: The price when the period started.
-
Close: The price when the period ended.
-
High: The highest price reached.
-
Low: The lowest price reached.
The color of the candle typically indicates direction:
-
Green (or white): Price closed higher than it opened (bullish).
-
Red (or black): Price closed lower than it opened (bearish).
Key Candlestick Patterns
-
Doji: When the open and close prices are nearly the same, signaling indecision.
-
Hammer: A candle with a small body and a long lower wick, indicating a potential reversal from a downtrend.
-
Engulfing: A larger candle that completely "engulfs" the previous one, often signaling a reversal.
Learning to read candlesticks can give you insights into market sentiment and possible reversals.
📊 Understanding Trading Volume
Trading volume tells you how much of a cryptocurrency was traded during a specific period. It's usually shown as vertical bars at the bottom of the chart.
Why is volume important?
-
High Volume: Confirms the strength of a price move.
-
Low Volume: Indicates weaker or potentially unsustainable price movements.
For instance, if Bitcoin breaks through a resistance level on high volume, it’s a stronger signal than a breakout on low volume, which might result in a fake-out.
🔍 Popular Technical Indicators
Technical indicators are tools that help traders interpret charts. Here are some of the most popular indicators used in crypto trading:
-
Moving Averages (MA):
These smooth out price data to identify trends over time. A 50-day MA or 200-day MA can indicate whether the market is generally moving up or down. -
Relative Strength Index (RSI):
The RSI ranges from 0 to 100 and measures if an asset is overbought (above 70) or oversold (below 30). It helps identify potential reversals. -
MACD (Moving Average Convergence Divergence):
MACD shows the relationship between two moving averages. When the MACD line crosses above the signal line, it could signal a potential buy. When it crosses below, it may suggest a sell. -
Bollinger Bands:
These bands expand and contract based on market volatility. When the price touches the upper band, the asset might be overbought; when it hits the lower band, it could be oversold.
📈 Identifying Trends
Recognizing market trends is essential for timing your trades effectively. There are three primary types of trends:
-
Uptrend: The price forms higher highs and higher lows.
-
Downtrend: The price forms lower highs and lower lows.
-
Sideways/Range-bound: The price moves within a horizontal range without a clear direction.
Drawing trendlines — diagonal lines connecting significant highs or lows — helps visualize these trends. Combining trend analysis with indicators like moving averages can provide clearer signals on when to enter or exit a trade.
✅ Tips for Reading Crypto Charts Successfully
-
Start with the larger time frames like daily or weekly charts before zooming into shorter periods like 1-hour or 15-minute charts.
-
Combine candlestick analysis with volume and indicators for more reliable insights.
-
Never rely on a single indicator. A combination of tools generally offers a more accurate market picture.
-
Practice regularly. The more you study charts, the better you’ll become at spotting patterns and potential opportunities.
🔚 Final Thoughts
Reading crypto trading charts is a foundational skill for anyone serious about trading or investing in cryptocurrencies. Understanding candlesticks, volume, indicators, and trends can help you navigate the volatile crypto market more effectively.
Remember, while charts can provide valuable insights, they don’t guarantee outcomes. Always use proper risk management strategies, and don’t invest more than you can afford to lose.